Both rural and urban GAA clubs face increasing challenges as demographics in Ireland change. This is one of a series of articles exploring the issues clubs face and what they are doing to adapt.
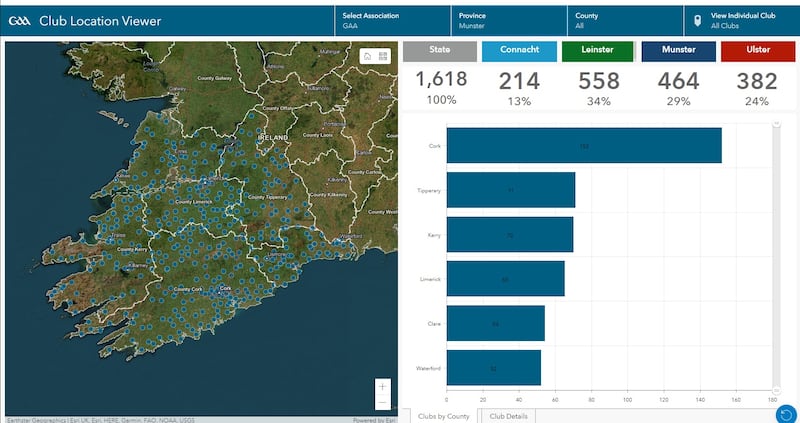
One of the biggest weapons the GAA has in its arsenal to combat the challenges associated with urbanisation and the population shift away from rural areas is the implementation of a geographic information system (GIS).
A GIS is a data programme that allows you to visualise information, specifically using mapping, which can help the GAA pre-empt future problems for clubs and other units, allowing them to plan accordingly on how to best deal with various anticipated scenarios.
It was initially introduced by the Community Development, Urban and Rural Committee chaired by Colm Cummins during John Horan’s presidency. But when Horan’s tenure ended in 2021, responsibility for developing the GIS was taken on by Croke Park.
READ MORE


It has continued to develop the system in partnership with People and Place, a research company based out of Maynooth University.
The membership information collected through the GAA’s Foireann registration system is used as the base data for the GIS. The GAA can then add layer upon layer of statistics on top by using relevant demographic information taken from the Central Statistics Office, school enrolment figures from the Department of Education, and the Northern Ireland Statistics and Research Agency for the six counties.
“The challenge is to make sure we are capturing the correct information and presenting it in the appropriate way,” says Dr Peter Horgan, the GAA’s strategy, insights and innovation manager.
By accumulating the data, different forecasts can be made. Firstly, the number of members in any given club can be mapped against the local population in that club’s catchment area.
For instance, if the figures show there are 100 boys aged 10 in a certain area and 50 of them are members, it informs the club they have a 50 per cent participation rate in that age category. But that is just a foundation block on which they can build a more complete picture.
“By looking at the data, population, births, school enrolment and so on, we are able to project forward,” explains Horgan.
“For some clubs that could mean that, based on the numbers of kids in the area starting school, we could be saying to them, ‘Look, you are okay now but in five or six years you might start feeling the pinch with regards to playing numbers.’ So that gives the club a lead-in time to plan a strategy.”
At the opposite end of the scale, the data could show a club is in danger of becoming oversubscribed in the future due to a combination of a growing population, birth rates and school enrolment. And that brings its own challenges that can be alleviated if known about in advance.
“We could be telling a club that because of the population coming on stream in their area over the next number of years, and based on participation rates they currently have, that participation rate is expected to increase by up to 50 per cent,” adds Horgan.
“In such a scenario they are probably going to need another field. And while recruitment and training of volunteers is not an easy task and something that is constantly a challenge, it is somewhat manageable.
“But if a club is informed they will need to get another pitch, then that’s a much more difficult issue. You have so many elements to that challenge – from cost to actual availability of an accessible field.
“So it is about trying to build a good understanding of what the GAA universe looks like so that clubs and counties can cater for their current and projected future needs, whether that’s an increase in numbers or a decrease.”
While Croke Park took on responsibility for the GIS in 2021, it is only since 2022 that it has fully started to realise and harness the potential of the data available in aiding the future operation of the association. The GAA hired a data analyst last year, Conor Weir, who now works daily on mining the GIS.
As with similar data systems, the key is not necessarily to collect the figures but rather to siphon the pertinent information and present it in an understandable way so those who need it can then use it.
“More information is not necessarily better – you can sometimes get piled under with too much information,” says Horgan. “It is about getting those nuggets of information that are useful.”
As the system develops, the GAA hopes to collate even more relevant information and eventually create data hubs for individual counties and provinces.
“Changes in urban-rural balances are going to continue, so it is going to need to be monitored on a consistent basis,” says Horgan.
“With the GIS, we are going to be able to project things forward through the data we have. We can project what the situation might look like over a period of time. It will be an ongoing exercise, providing the information to clubs and counties that will inform them of the work they will need to do.”